

When building developer portals and content, decision-making speed often matters more than perfectionism. You can spend months developing a feature, go through iterations, invest resources, and still, after release, see that your target audience is not interested enough or simply is not using it enough.
Start with a concrete hypothesis, not a wish
The hardest part of a product sprint is identifying the right issue and a hypothesis you can actually test.
“We want to improve UX documentation” is not a real issue. It should be more concrete and measurable, for example:
- Half of users drop after the “First API Call” step in the conversion funnel: Doc Visit -> OpenAPI Download/Copy -> First API Call -> Sustained API Calls.
- Time-to-completion increases by 20 minutes during a specific Learning Lab or tutorial session.
- Average session duration in the Cloud IDE is under 10 seconds.
Each of these can be measured, improved, and checked again after the release.
Measure what matters: Product-market fit indicators for developer portals
After each release, it is important to measure success and consolidate relevant business and product data into a single dashboard for key stakeholders and for the next sprint. That is where product-market fit (PMF) indicators become important.
Possible key product-market fit indicators for developer portals:
- Growth in usage and registration among individual and enterprise customers, with an emphasis on Activation Rate and Return Usage.
- For education content or guides, Time-to-Completion should match the estimated time. If a lab is designed for 30 minutes but averages an hour, there is too much friction.
- Unique visits to documentation pages and downloads or copies of OpenAPI, SDK, and MCP documentation correlated with an increase in API requests.
- Low support tickets per 100 active developers (or per API request volume).
- A low 4xx error ratio after a docs update or release, alongside a strong API usage success rate.
- Time to First Hello World (TTFHW) – first app, integration, or API call – under 10 minutes.
Product analytics events we track or recommend
Product analytics and user experience sessions can give you the information you need to make product decisions. Analytics can also enrich your user stories and feature requests with real data.
Here are examples of Google Analytics events that help explain how users interact with developer-oriented content. We already use some of them in practice, while others are suggestions that may be useful for teams building developer portals and content.
sign_up,login– for portals that require login.tutorial_begin– a tutorial was opened, and the user spent 10+ seconds on the page.tutorial_complete– triggered by multiple signals, such as time on page, scroll depth, or executing or copying related commands.search,view_search_results– to understand search patterns and how users interact with results.
There is also a specific set of events that helps us understand how content is consumed by users and AI coding agents or assistants:
copy_for_ai– how many times and on which page users copy Markdown to continue work in AI agents.text_select/text_copy– triggered when the user interacts with 500+ characters; useful as a “Copy for AI” proxy even on pages without an explicit button.download_openapi_doc,download_mcp_doc,download_sdk_doc– how many times each full document is downloaded for local use or AI-agent workflows.
Validating decisions: analytics + user feedback + business impact
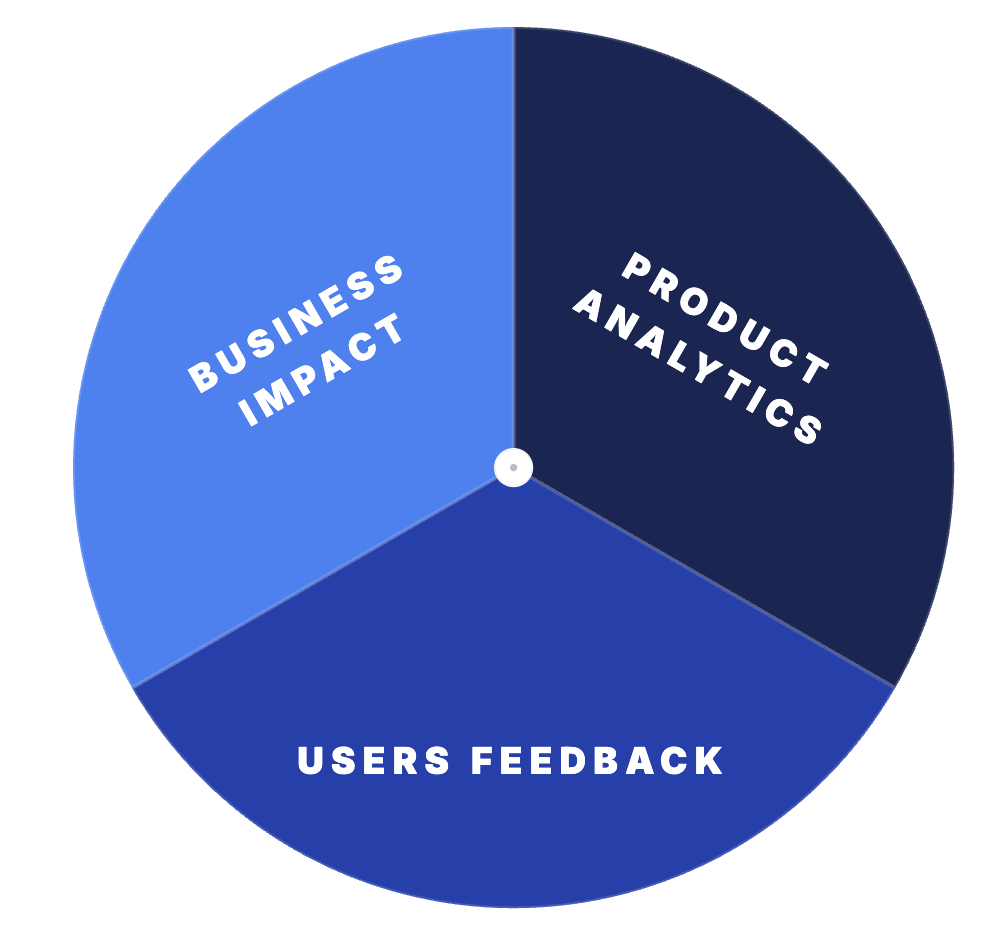
A feature or change is a strong fit when you can confirm the hypothesis from three angles:
- Product analytics
- User feedback
- Business impact
User feedback and analytics feeding product decisions
If all three support the same decision, it is much easier to move forward. If they do not, it usually means the hypothesis was not specific enough.
How we apply this at DevNet
Here is how that loop – hypothesis, analytics, feedback, decision – works in real examples.
Example 1: README-first Cloud IDE
During regular UX and feedback sessions, users told us they wanted to see a repo’s README with instructions and related content, and a clearer guide on how to use the IDE itself, while working with code samples in the Code Exchange Cloud IDE. Some of these environments are unique, such as Cisco NSO containers that users can spin up directly in the Cloud IDE.
Analytics showed the same problem: the default “Get started with VS Code” window was distracting users rather than helping them.
We ran a comparative analysis across two periods, looking at total pages analyzed, pages with sessions under 2 minutes, the percentage of low-duration pages, total views, the shortest session duration, and the number of critical pages with an average duration under 15 seconds. The data confirmed the pattern, and the solution was to open the repository README instructions by default.
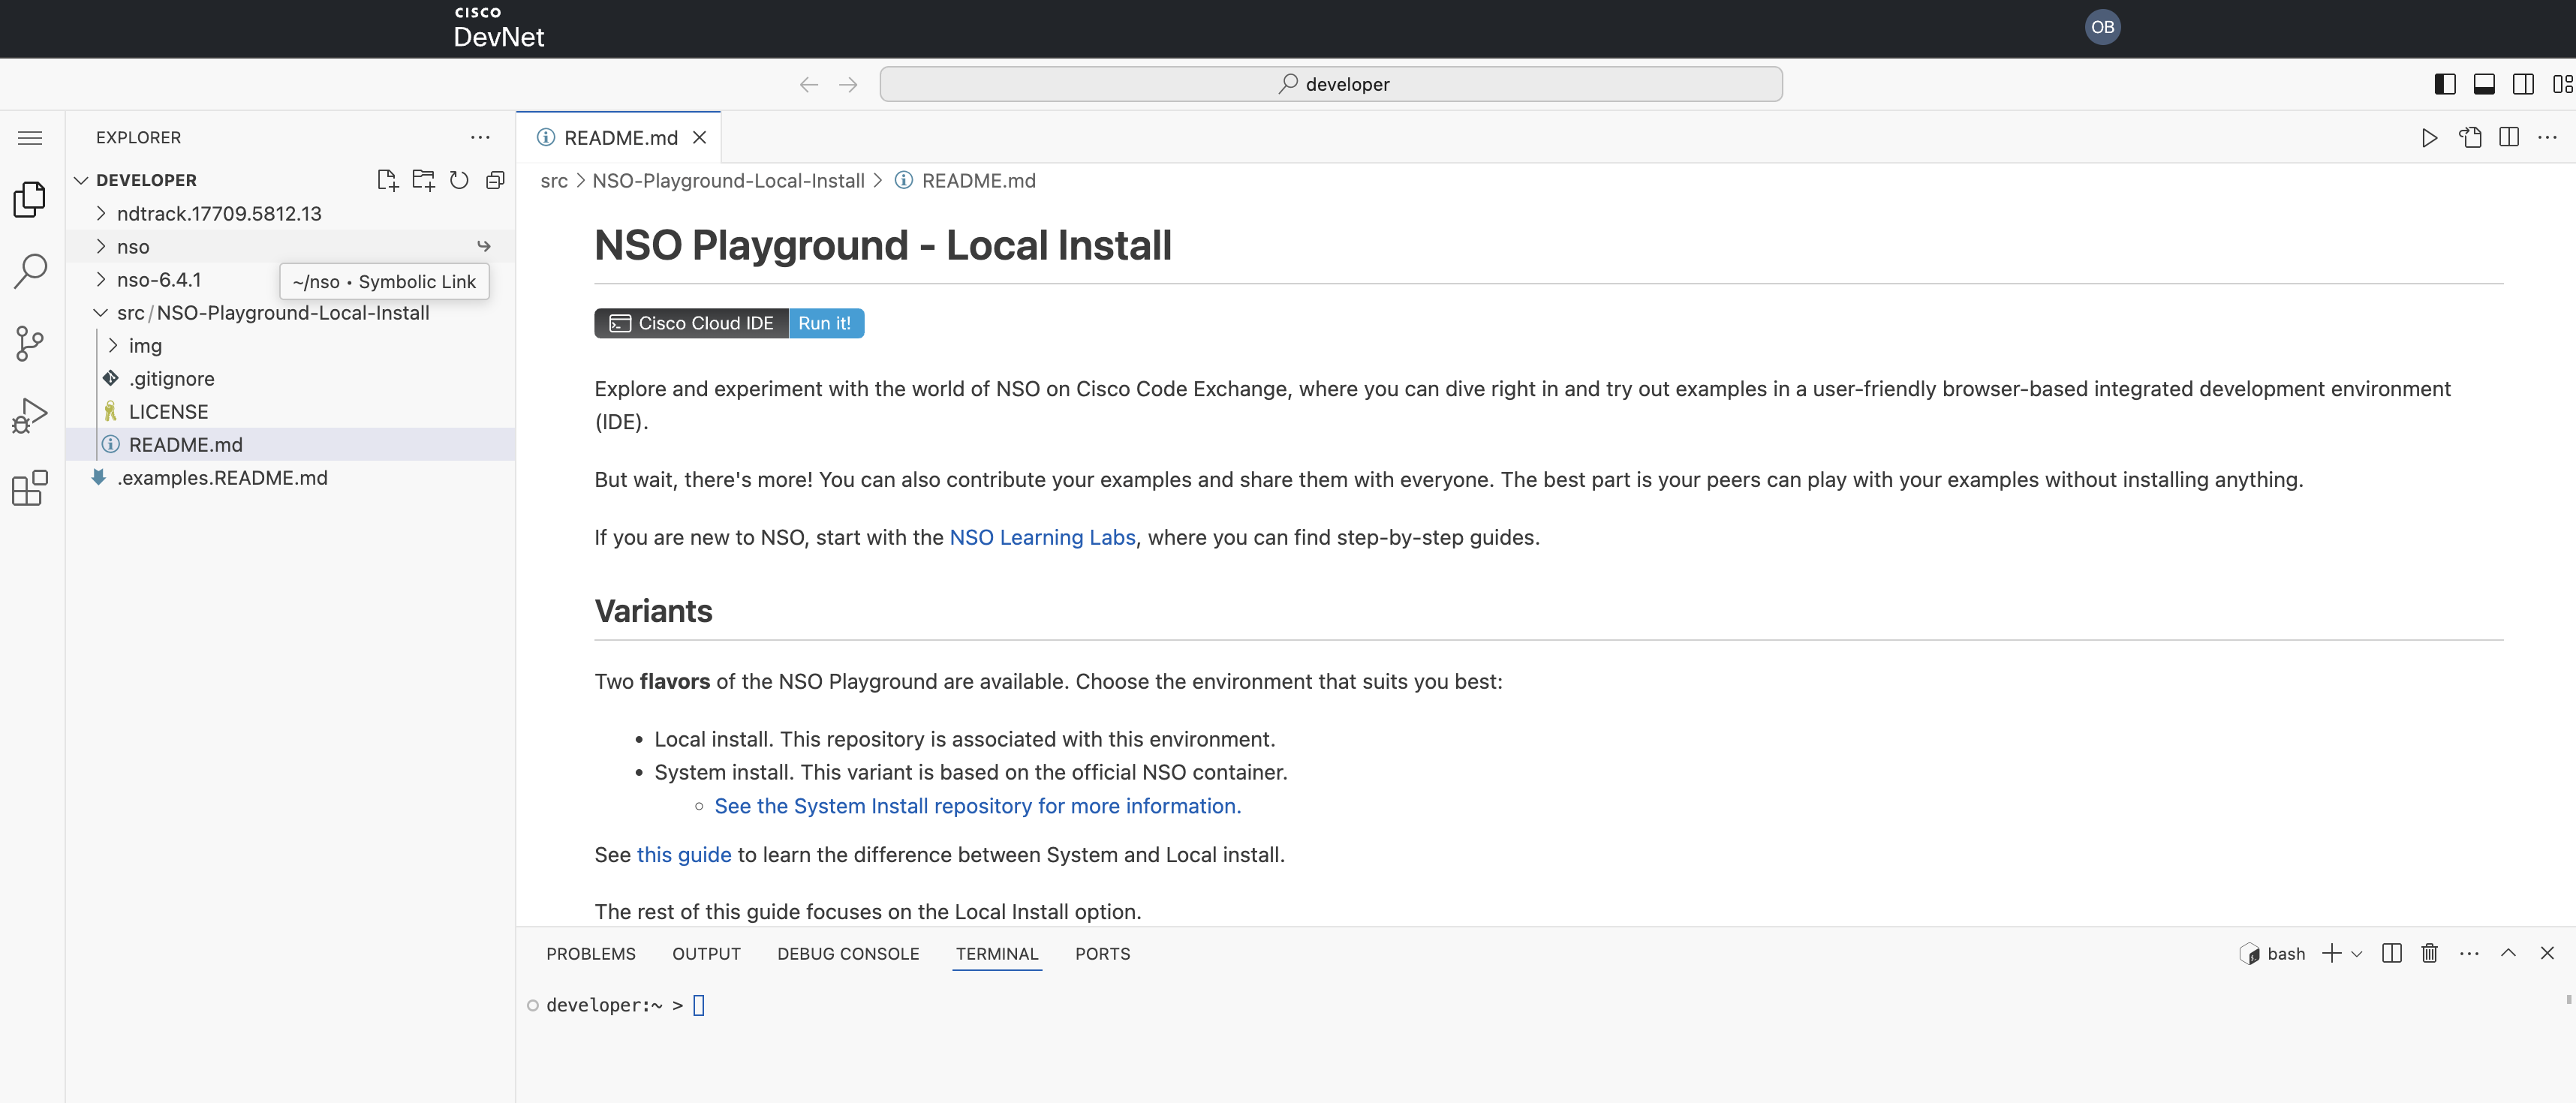
Updated Cloud IDE interface with the repository README opened by default
Example 2: Deprecating outdated repos with a related-repos widget
The second issue was a large amount of outdated code sample content. Looking at the data, we saw that these repositories still attract significant traffic, so there was business value in handling them carefully. There were two options:
- Remove the pages entirely and let users hit a 404.
- Deprecate them, show a clear deprecation message, and display a widget with other related repos.
We chose option 2 because it gives users a more consistent experience and points them to content that still works.
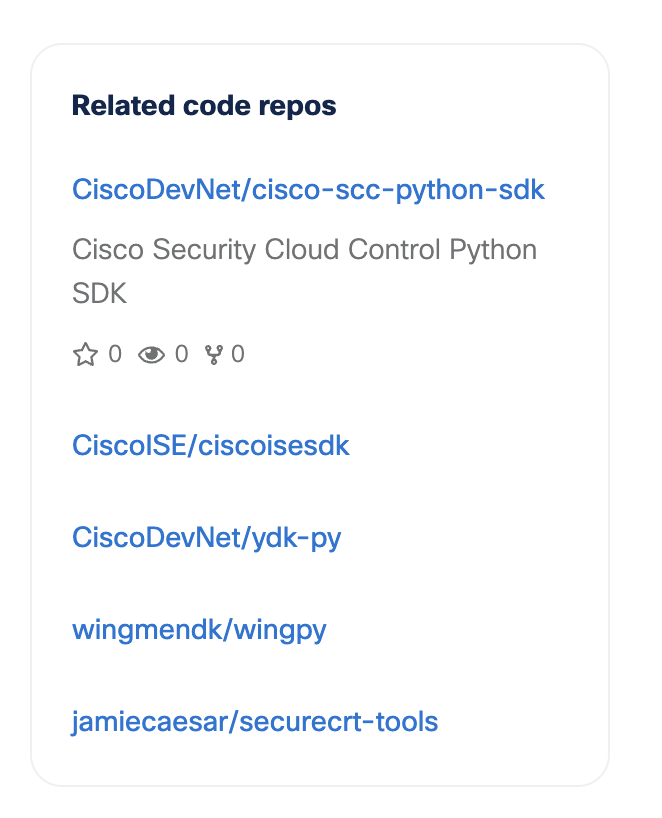
Widget with related repos on Code Exchange
Example 3: “Developed by” filters in the MCP catalog
A few months ago, we released the AI repo catalog on Code Exchange, where we gather MCP servers and AI agents related to Cisco technologies. In UX sessions, users told us they wanted to distinguish between MCP servers released by product teams and those released by the community:
- Product-team MCP servers tend to be a more stable choice, and most of them are remote.
- Community MCP servers are open source, so users can read the code and configure MCP tools, prompts, or resources themselves.
Both types are valuable, but users wanted to quickly distinguish between them. To address this, we added filtering options and introduced a dedicated badge highlighting Cisco-developed servers.
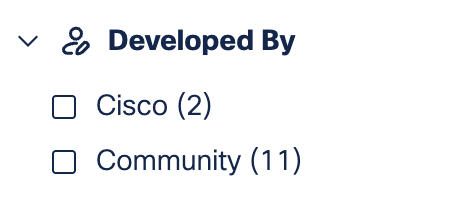
“Developed by” filters on the MCP catalog
Join DevNet feedback sessions
Many of these changes started in user experience sessions. Analytics can show us where users drop off or struggle, but talking to users helps us understand why and what to improve next.
Want to share your feedback about developer content and the Cisco DevNet platform? Write to us at devnet_feedback@cisco.com.